
For health-professions education
One case. One chart. A debrief everyone can see.
Give learners and faculty the same 3D symptom pattern for simulated and standardized patients, OSCEs, and documentation practice.
The teaching problem
Documentation is taught from inconsistent examples.
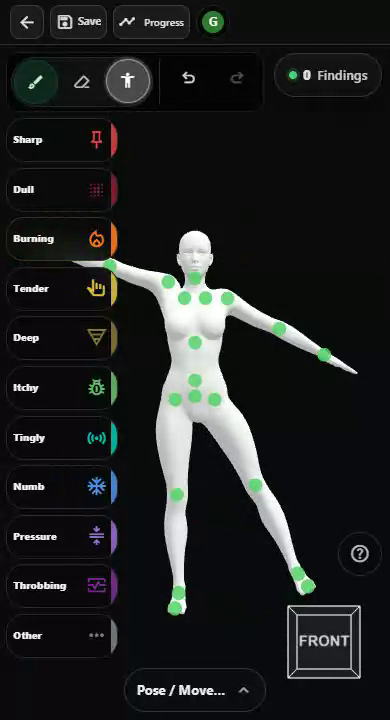
Flat body charts vary by template and instructor, so learners can practise against a target that moves. A shared 3D chart gives the cohort one structured surface and one symptom vocabulary to capture, document, and discuss.
- Every learner can start from the same simulated presentation.
- Position, area, intensity, nature, and time stay visible in the record.
- Laterality and body surface are classified rather than left to handwriting.
- A saved map gives debriefs something concrete to return to.
In simulation
Build the symptom pattern into the case.
A faculty-authored map can travel with a simulated case as a reproducible snapshot. Learners can then document the presentation in the same 3D workspace used by the case, without relying on an instructor to redraw the pattern for each section.
- Use snapshots with simulated or standardized patient encounters.
- Run an OSCE or lab section against a consistent symptom map.
- Represent multiple symptom findings without collapsing them into one mark.
- Export a plain-text note, printable encounter, or structured record.
For debrief
Review what the learner actually documented.
The map keeps the learner’s symptom distribution visible after the encounter. Faculty can discuss what was included, how it was described, and how the record changed over time without treating a software-generated metric as a grade.
- Compare learner documentation against the case map or another attempt.
- Discuss distribution, spread, laterality, and symptom nature from the chart.
- Use snapshots and timelines to teach documentation across encounters.
- Keep scoring and competency decisions in the program’s own rubric.
Across a program
A common chart for more than one profession.
The same symptom record can support documentation practice in physical therapy, physical therapist assistant, medicine, nursing, athletic training, and other health-professions programs. Each program decides its learning objectives, case instructions, and review process.
- Use one chart when professions share a simulated patient.
- Teach a consistent handoff vocabulary across learner roles.
- Keep profession-specific expectations in the surrounding scenario and rubric.
Before you plan a course
The chart is a teaching surface, not the curriculum.
3DPainMap is an in-development measurement and documentation tool. The limits below distinguish what the chart provides from what faculty and the surrounding simulation platform must provide.
- It does not grade learners, score clinical reasoning, or make competency decisions.
- It does not diagnose, recommend treatment, or interpret a symptom pattern.
- Standalone charts are stored in the browser on the device that made them; they do not sync between learners or faculty.
- Programs remain responsible for case design, learning objectives, rubrics, accessibility, consent, and data-governance decisions.
Start with one course, one cohort, or one case.
Tell us what learners should document and how faculty want to review it. We will tell you what fits 3DPainMap, what belongs in the simulation platform, and what is not built yet. You can also write to partnerships@3dpain.app directly.