
Framework
PAINT
The measurement framework: Position, Area, Intensity, Nature, Time.
How it works
Position, Area, Intensity, Nature, and Time — captured on an anatomy-classified 3D surface, measured in real square millimetres, and exported as structured records.
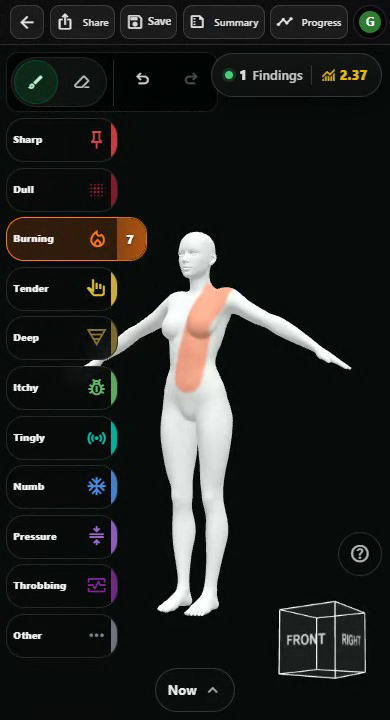
The surface
Painting happens on a 3D mannequin whose surface is divided into a fixed grid of texels and classified, triangle by triangle, against a reviewed anatomy atlas. Because the grid is fixed and the classification is reviewed rather than estimated, a painted region has a real area in square millimetres and a real anatomical label — and the same region on the same body variant means the same thing in every capture.
| Sampling | Male | Female | Youth / neutral |
|---|---|---|---|
| Resolution | 1.76mm | 1.64mm | 1.53mm |
| Mean texel area | 3.09mm² | 2.70mm² | 2.35mm² |
| Body surface area | 20,920cm² | 18,280cm² | 15,880cm² |
| Reference body | 1.97 m, 80 kg | 1.85 m, 65 kg | 1.65 m, 55 kg |
The framework
Four axes describe a symptom. The fifth is the one records almost always lose.
Anchors each symptom to where it sits on the body — on a 3D model you can pose to match the patient, with that posture recorded alongside the chart.
Measures how much body surface is involved, in real cm² and percent BSA on the reviewed 3D mannequin.
Keeps symptom strength attached to the painted surface so the PAIN-Index is not flattened into presence versus absence.
Preserves the qualitative character of the symptom so burning, aching, pressure, or numbness remain distinguishable.
Tracks how a symptom changes across snapshots — whether it persists, spreads, resolves, or recurs — so reassessment asks where it is better, worse, new, or resolved.
The T in PAINT
Each visit is a PAINprint Snapshot. Stack snapshots and you get a PAINprint Timeline — the symptom story over time. Trajectory is how that story moves: spreading, shrinking, intensifying, resolving, or recurring. That is the difference between asking "where does it hurt?" and "where did it hurt, how much, what kind, and what changed?"
The measurement framework: Position, Area, Intensity, Nature, Time.
The painted spatial record for one finding at one moment.
A time-stamped chart state composed of one or more PAINprints.
An ordered sequence of Snapshots — the symptom story over time.
A normalized impact score derived from measured area × reported intensity.
(weighted area / total BSA) × 100Derived objects
Beyond the exports, every capture yields a derived metric panel, a snapshot, and — stacked over time — a PAINprint Timeline. Examples are simulated and de-identified.
PAIN-Index ............ 7.4 / 100
Painted footprint ..... 3.1% BSA
Adjusted local intensity 6.8 / 10Snapshot · Visit 3 · 2026-05-12
2 findings · right lumbar, right thigh
Replays to the same rendered surface.Timeline (3 snapshots)
new · resolved · spread · persistent
PAIN-Index 9.1 → 8.0 → 7.4Outputs
Every output derives from one finding-level model. Examples are simulated and de-identified — they show the structure, not real patient data.
<section class="encounter">
  <h1>Symptom map — visit 3</h1>
  <p>Findings: 2 · PAIN-Index: 7.4</p>
  <figure><img alt="3D body chart"/></figure>
</section>Baseline → Visit 2 → Visit 3
PAIN-Index 9.1 8.0 7.4
Area %BSA 4.2 3.6 3.1
Status: 1 finding no longer chartedPatient reports aching, burning pain over
the right lumbar region and posterior thigh.
Area ~3.1% BSA. PAIN-Index 7.4 (was 9.1).
Left arm no longer charted since baseline.finding,region,side,nature,area_cm2,pct_bsa,intensity
1,lumbar,right,aching,612,3.1,7
2,thigh,right,burning,344,1.7,6{
"schema": "painprint/3",
"snapshot": "2026-05-12T14:08Z",
"findings": [
{ "id": 1, "nature": "aching",
"areaCm2": 612, "intensity": 7 }
]
}{
"resourceType": "DocumentReference",
"status": "current",
"type": { "text": "Symptom map" },
"content": [{ "attachment": {
"contentType": "text/html" } }]
}Where the software stops
There is no model in this pipeline, no inference, and no prediction. Each figure is a deterministic transform of what a human put on the chart, and the exact contract that produced it — scoring version, body-model version, every formula, the area threshold, the body-surface-area denominator, the overlap policy — is emitted alongside the structured exports. That is what makes a number from two years ago still readable.
The workspace is free and open, and nothing you draw leaves your device.